
Send a request
Thanks for your submission, we'll get back to you shortly!
Oops! Something went wrong while submitting the form.
As much of our society’s work takes place online, marketers can use data to help them gauge performance and, for startups especially, to see if they’ve established product market fit—a key concern for many. While it’s great that we have so much digital information at our disposal to learn about user behaviour, making sense of all of the data and metrics can be challenging. With the tremendous amount of information available, how can we as marketers determine what key performance indicators (KPIs) will best serve our digital marketing strategies? In this article, we’ll take a look at some key metrics, what they can tell us about our performance online, and what to look out for in order to improve customer and user experience.
With many startups and smaller marketing teams in a perpetual crunch mode, we see many decision makers pressured to make quick and reactive judgements based on very little information. It can be alarming to see dropping click-through rates, customers abandoning check out, sales not increasing, high bounce rates, and low conversion rates. Jumping to conclusions and making snap decisions in these circumstances is, while extremely tempting, very rarely an effective use of your company’s resources, time, or energy. Instead, follow the guidelines listed below to stay level-headed and well-informed.
Let’s begin with a baseline. The following metrics can be used to manage expectations and to give you an idea of what current industry standards look like in 2021. Use this section as a guide to ensure your campaigns are performing at typical industry levels. In the event that your campaign metrics are notably off-base, try taking a closer look at the potential causes and implications to determine where you might need to allocate more time and energy.
ROAS is the return on investment for your ad campaigns. This rate is calculated by measuring conversion value over channel spend. Using this metric will give you and your team a better understanding of the channels and campaigns in which to invest, based on how they compare to one another in terms of performance. The current average for ROAS for Google is 200% ($2 earned for every $1 spent). It is also suggested that anything over 400% (a 4:1) ratio is excellent in terms of performance (Berry, 2020). Anything under a 1:1 ratio shows that some real reconsideration should be made.
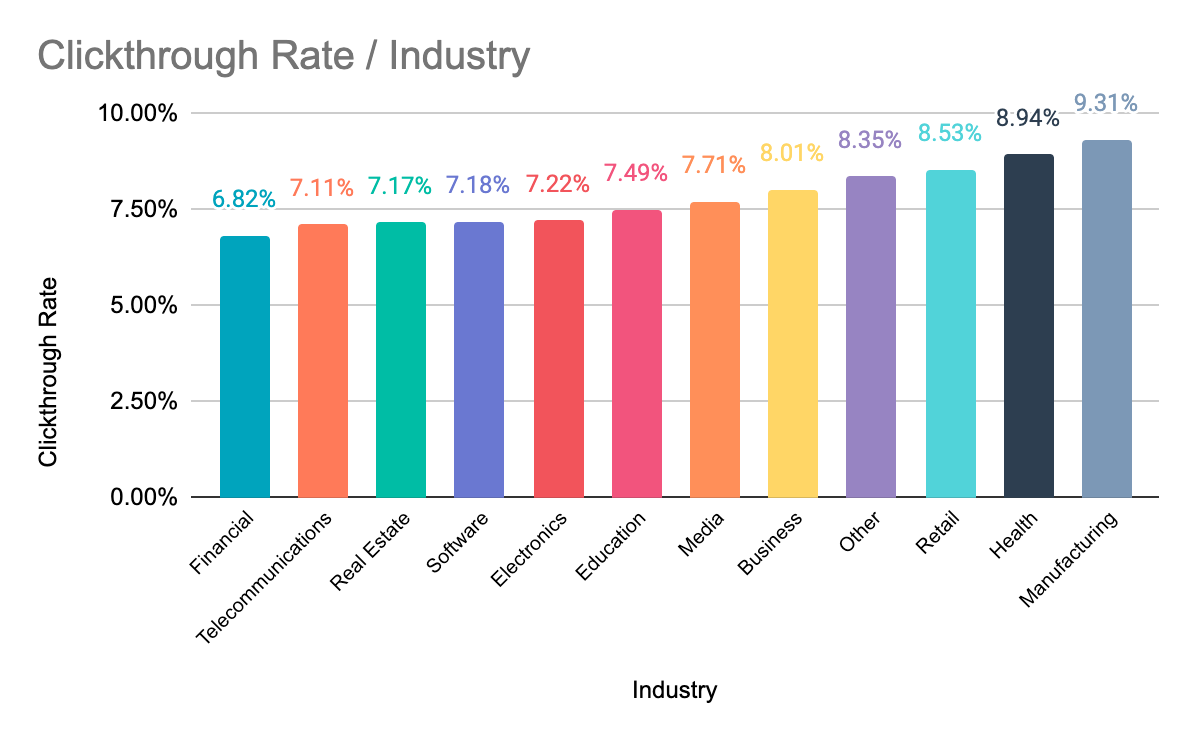
The ad CTR is the percentage of total ad views that result in clicks. This metric helps determine your ad rank and your cost per click (CPC). While a “good” CTR is hard to define as it varies by industry, company, and individual goals, you should be able to detect variations in your Google Ads CTRs as you analyze and form a baseline reference. As a general reference point, a “good” Google Ads CTR can be broken down into two categories: Search ads (paid ads on the Google search page) and Display Ads (paid ads hosted on other websites). CTR norms for search ads can generally range from around 2-3% while display ad CTRs are generally much lower and can range anywhere from 0.39% to as high as 1.08% (Loudmouth Media, 2020).
You can use this tool by Wordstream to measure your Google Ads CTR and compare it to your competitors’.
Whenever you launch a new digital campaign, it’s important to consider the amount of time it takes for momentum or activity to build around it before you begin altering your strategy. It typically takes around 90 days to build momentum around a digital marketing campaign, but your company may have a much different baseline measure (LoFrisco Jr, 2020). The important thing here is to regularly check on how long it takes for your campaigns to build momentum (activity, views, organic searches, etc.) and to note if the momentum continues past its initial peak. Some marketers may feel the need to edit values on their digital ad campaigns if they see the CPC rising or falling, but without waiting the recommended 90 days, you likely won’t have enough data to base any of your adjustments off of and you won’t know the CPC range.
To ensure you’re getting more accurate data in your search campaigns, be sure to monitor the search queries and add negative keywords as you go, so you’re excluding irrelevant keywords from your campaigns and using ad spend to learn more about your audience.
For marketing emails, the email CTR will give you an indication of whether or not your audience is compelled enough to take action from the email campaign you’ve sent. This applies to both newsletter subscription-based as well as lead list emails. In 2021, email CTRs averages are said to range between 2.6% to 3.43% and can vary depending on factors like industry and email service provider (Duò, 2021). The current data regarding average CTR available does not discern between newsletter subscription-based or lead list email campaigns. One thing to note, however, is that CTR for newsletter subscription lists can be improved dramatically by incorporating customer segmentation into your strategy. Similarly, adding a personalization factor into lead list emails, such as addressing your lead by their first name, can improve CTR by up to 139% (MacDonald, 2021).
Noting email CTR performance can also tell you a lot about the behaviour of your subscribers and leads and what appeals to them. While variations in email CTR certainly occur, large discrepancies can indicate something such as a broken link or your call to action might need adjusting. Many popular CRMs like Hubspot, Salesforce, and Keap can help manage your email communications by automatically adding notes to customer files, triggering follow-up actions to continue the momentum, and providing key analytics insights.

The bounce rate refers to the percentage of visitors that leave a webpage without taking further action. This can include clicking a link, submitting a form, or making a purchase. Most websites can expect to see bounce rates fall between 26% and 70%. An extremely high bounce rate (above 90%) will let you know something is off with your page, while a very low bounce rate (below 20%) could indicate an issue with your analytics implementation (RocketFuel, n.d.). While bounce rate is important to keep track of when making website updates, the user behaviour should also be contextualized. For example, if you have multiple campaigns running across various channels simultaneously, you may notice you have a higher bounce rate than normal. This could be because you may be driving more traffic, but with less relevance. This is especially true when it comes to running discovery campaigns through multiple channels, where increased exposure can also be accompanied by an increase in bounce rates. When running omni channel campaigns, look at user behaviour within the wider context to understand why your analytics might look the way they do.

Now that you have a general understanding of which metrics to keep your eye on, let’s discuss some red flags to watch out for. These can include the following:
There are many reasons you might be getting these results. Despite your best efforts in trying new website copy, creating new ads, revising your keyword strategy, retargeting audiences, and broadening your list of prospects, you might not be seeing the issue for what it really is. Before you attempt to restructure your entire strategy, take a closer look, ask why these issues might be occurring, and try to determine what they might be telling you about your users and their experience.
As mentioned above, a good way to measure ad performance is by checking your ad’s CTR. If you’ve noticed a recent drop in the CTR for an ad campaign that might indicate that your audience targeting could be improved. First, are you running ads too early? Is the audience you’re targeting the right target for your product or service? If you’re confident that you know who your target audience is and are still seeing low CTRs, are you sure your assumptions about your audience are accurate? It may be worthwhile to audit your campaigns and channels to recenter them around your target audience.
Another reason you might see low CTRs is that your messaging isn’t quite hitting the mark with your audience. When it comes to effective campaigns, it’s all about sending the right message to the right people. Keep your messages clear and concise, so you’re communicating value to your audience as efficiently as possible. You need to make sure that your offer is really what your audience wants to see. A good practice is to try A/B testing with your ad messaging to determine what messages really resonate with your intended audience. For Google Ads campaigns, try a few different messages and see which works best—and let Google’s engine do the work of figuring out which messages to serve based on the action you want the user to take. A caveat—be sure to limit the time you spend on writing copy. It’s easy to invest too much time into wordsmithing ad copy, when the real issue is low search volume or poor targeting.
While paying attention to CTR is important, for most of us, the ultimate campaign goal is conversions, not clicks. Checking a campaign’s conversion rate will tell you if your clicks are converting—the step beyond this is for you to determine whether the conversions are good quality and are worth the spend. First, check to see that conversion tracking is set up properly. If that’s done, you can begin diagnosing the issue. A low conversion rate could indicate that the offer in your ad and the action on your landing page are misaligned. Is your site’s landing page difficult to navigate? How many clicks on your website does it take for a user to complete a conversion? (The fewer, the better.) Where in the process are they dropping off? Are site visitors finding your offer to be of value? Your landing page should clearly and simply communicate your value proposition and make it easy for visitors to take the desired action.
Is your lead inquiry inbox looking unusually barren? You might find that your obstacle is simply that your sign-up form or submission button isn’t working. Other times, it could be that your lead form is too complex or lengthy, which puts barriers between you and your potential customer before you even get to know them. Make sure that your potential leads can easily contact you with minimal friction points in between to help ensure smooth and successful conversions.
When you do establish a connection with new customers on your website, it is important to set reasonable expectations for those conversions. Keeping track of your lead conversion rate (new customers divided by new leads x 100) is a good way to measure your site’s ability to capture the right kind of audience and turn visitors into paying customers. The average lead conversion rate hovers between 2% and 5% with the general consensus citing that above 10% indicates excellent performance (Calvello, 2021).
No one wants to see high bounce rates when checking their analytics. Much like CTR, however, bounce rates should always be looked at in relation to your campaign, business goals and the benchmark metrics you set to compare your results to. A higher than average bounce rate (generally upwards of 55%) could indicate that your site has issues with your page loading speed, misleading title tags or meta descriptions, confusing layout, poorly functioning UX design or other technical errors (Willson, 2020). You can avoid running into these issues by regularly testing your site for functionality and performance.
Before you start troubleshooting functional issues, consider where your traffic is coming from. For example, if you’re running ads, you might be attracting an audience that’s broader than your organic one. In this case, you’d expect bounce rates to increase as your campaigns ramp up and to normalize as you refine them.

Interpreting analytics and metrics can be both overwhelming and frustrating without the proper lens. Knowing baseline or industry-accepted values can help you manage expectations and decide where to focus your energy for maximum impact. When it comes to digital marketing, making snap decisions can often lead to even more confusion. Trust us, digesting the intel takes a little time. Once you start taking the time to absorb all the data, you’ll start to understand what you’re looking for more quickly.
If you’re hitting a wall or simply don’t have the time to dig into your digital strategy, it might be wise to hire specialists to handle growth. At Skyrocket, our digital marketing experts can analyze and diagnose issues that might go otherwise undetected.
We’re here to help. If you’re ready to optimize your digital strategy and troubleshoot your pain points, contact us for more information on how we can be of service to you and your brand.
.png)
The power of product management is more important than ever before. From guiding the path ahead to blazing a trail and reaching greatness, every step of the process is critical to success.
Brand awareness is a crucial metric for launching a branded digital campaign, but it's also one of the most challenging to measure.
What is the number one pastime of a bored digital consumer? It’s scrolling endlessly through their feed looking for something to spike their dopamine — and chances are these are the best times that a consumer is willing to spontaneously spend money.